Platform · Insights Engine

Most loyalty platforms tell you
what happened. Perx tells you
what's driving it and what to do next.

Insights Engine closes the loop that every other loyalty platform leaves open. It maps every mechanic, every nudge, and every campaign directly to a P&L outcome — surfacing what the data is telling you, attaching the recommended next action, and giving every stakeholder from CMO to board the intelligence to act on it. Not next week. Now.
Insight engine

What makes it different

Most loyalty programmes generate engagement data. Almost none can answer the question every stakeholder actually asks: which mechanic, which campaign, and which segment drove that revenue? The data is there. The connection to the P&L isn’t.
Insights Engine makes that connection. Board-ready visuals for your CMO. Predictive signals for your growth team. P&L attribution for your CFO. Every loyalty mechanic mapped to a revenue line — not an engagement score.
The problem it solves

You have loyalty data.
You don't have loyalty intelligence.

The gap between a loyalty dashboard and a loyalty insight is the gap between knowing what happened and knowing what to do next. Most loyalty platforms stop at the first. The data sits in a report. The pattern nobody sees drives churn nobody predicted. And every stakeholder keeps asking questions nobody can answer.

Your loyalty spend has no P&L attribution

You know your campaign reached 80,000 customers. You cannot tell the board which ones transacted because of it, how much revenue it generated, or whether the reward cost was justified.

Churn you could have predicted — two weeks after it happened

By the time the dashboard shows a drop in active users, the customers have already left. The signal was there 30 days earlier. Nobody was watching for it.

Data rich. Decision poor.

The data exists across transactions, behaviours, redemptions, and campaigns. It lives in five different reports. Your team exports it into spreadsheets. The insight that would have changed the campaign is buried in row 4,000.

Board reporting that cannot answer the board's questions

Engagement rates and open rates are not boardroom metrics. Your CMO needs Transaction Lift. Your CFO needs Redemption ROI. Your board needs a direct line from loyalty spend to net income.

How Insights Engine solves it

Three intelligence layers. One engine
that maps loyalty to profit.

Live dashboards that surface anomalies before your team spots them. Attribution reports that close the loop from nudge to transaction. And a premium advisory layer where AI analysis and Perx’s programme expertise combine to turn your data into a structured growth roadmap. Every layer built for a different stakeholder — all pointing to the same answer: what to do next.

Real-Time Dashboards

Live signal. Not last week's data.

Reports

The report the board has always asked for.

Advanced Insights ✦

Premium · AI + Expert intelligence.

Revenue Visibility

Know what's driving revenue
before the week is out.
Not after the quarter closes.

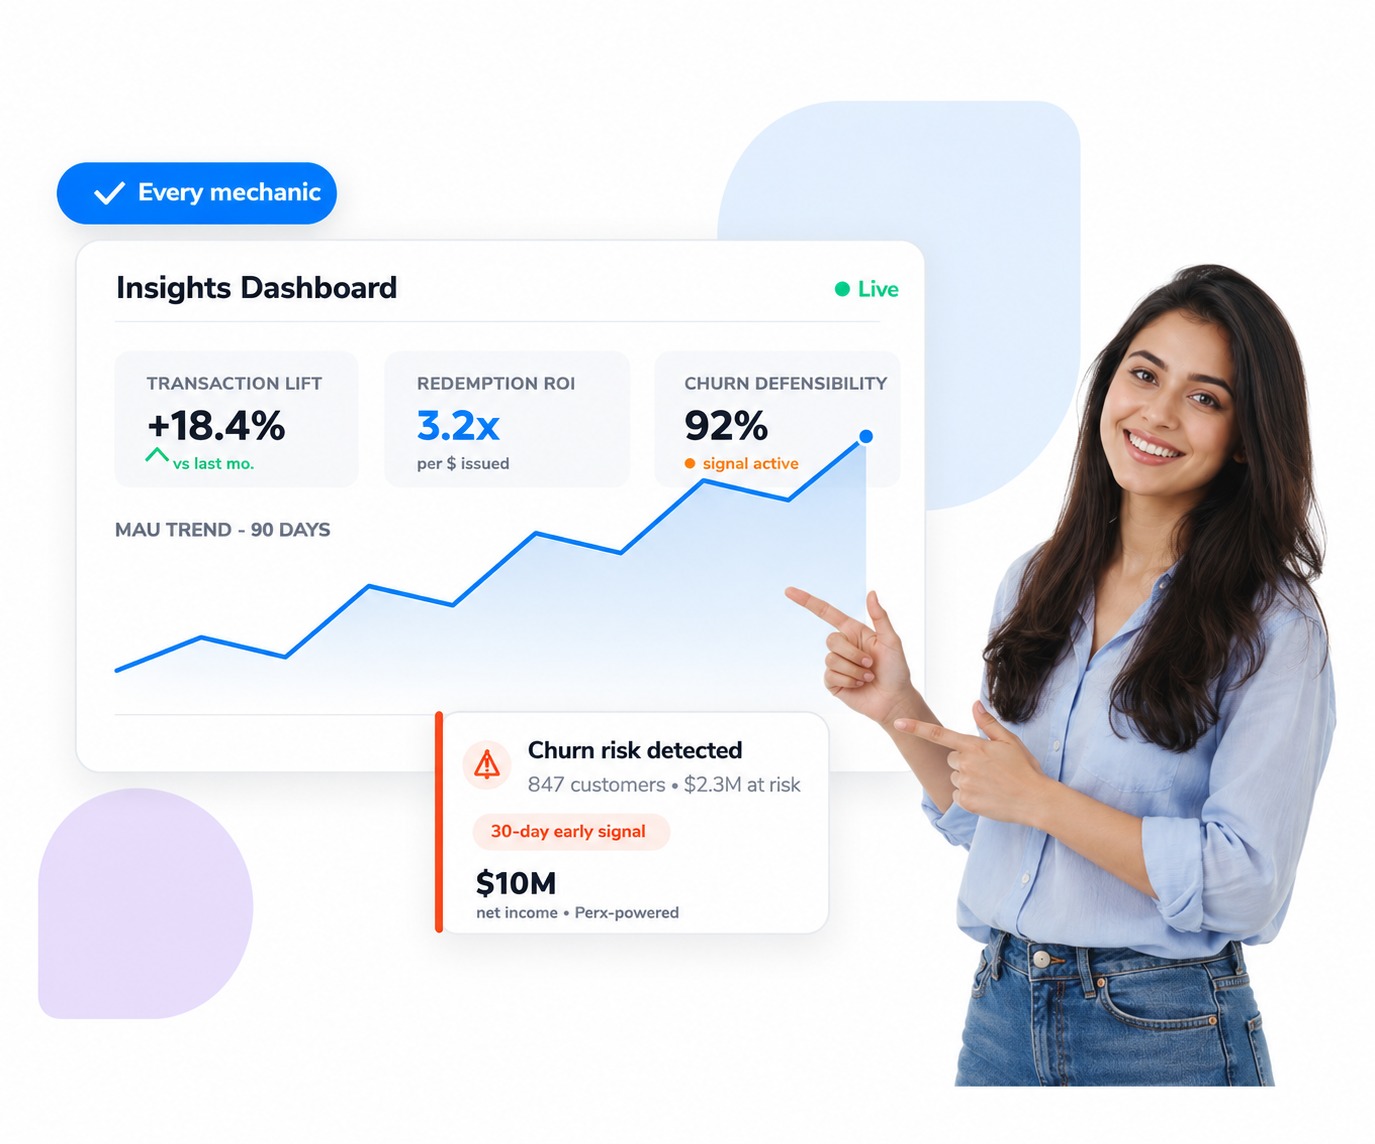
Live dashboards surface not just what happened but what’s driving it — Transaction Lift, Redemption ROI, Churn Defensibility, and MAU/DAU trends mapped directly to business outcomes. Anomalies are flagged before your team spots them. At-risk customers are identified before they disengage. The recommended next action is attached to every signal.
“Most loyalty dashboards show you what happened. Insights Engine shows you what’s happening, what’s about to happen, and what to do about it — before the window to act has closed. The difference between those two things is the difference between a reporting tool and a revenue intelligence system.”
Transaction Lift Tracking

Measure the direct revenue increase attributable to each campaign — not just the engagement rate

Live visibility on the incremental revenue generated by every mechanic, every campaign, and every segment. Your team sees — in real time — which loyalty investments are moving the P&L and which are generating activity without revenue.
Result: Campaign spend justified by revenue, not engagement score
Churn Defensibility Signals

Identify at-risk customers 30 days before lapse — with revenue-at-risk attached

At-risk customers are flagged before they disengage, with estimated revenue-at-risk quantified so your team prioritises by P&L impact, not gut feel. The difference between reactive churn management and proactive retention is 30 days of signal.
Result: Retention prioritised by revenue impact — not recency of last login
Redemption ROI

Track the return generated per dollar of reward issued — in real time

Every reward issued appears as a tracked investment — not a cost. The dashboard shows return per dollar of reward across every mechanic, every merchant, and every segment. Over-rewarding is visible the moment it starts. Under-performing reward types surface before they drain the budget.
Result: Reward spend optimised continuously — no manual analysis required
MAU & DAU Trends

Monitor active user growth as a leading indicator of CLTV — not a lagging vanity metric
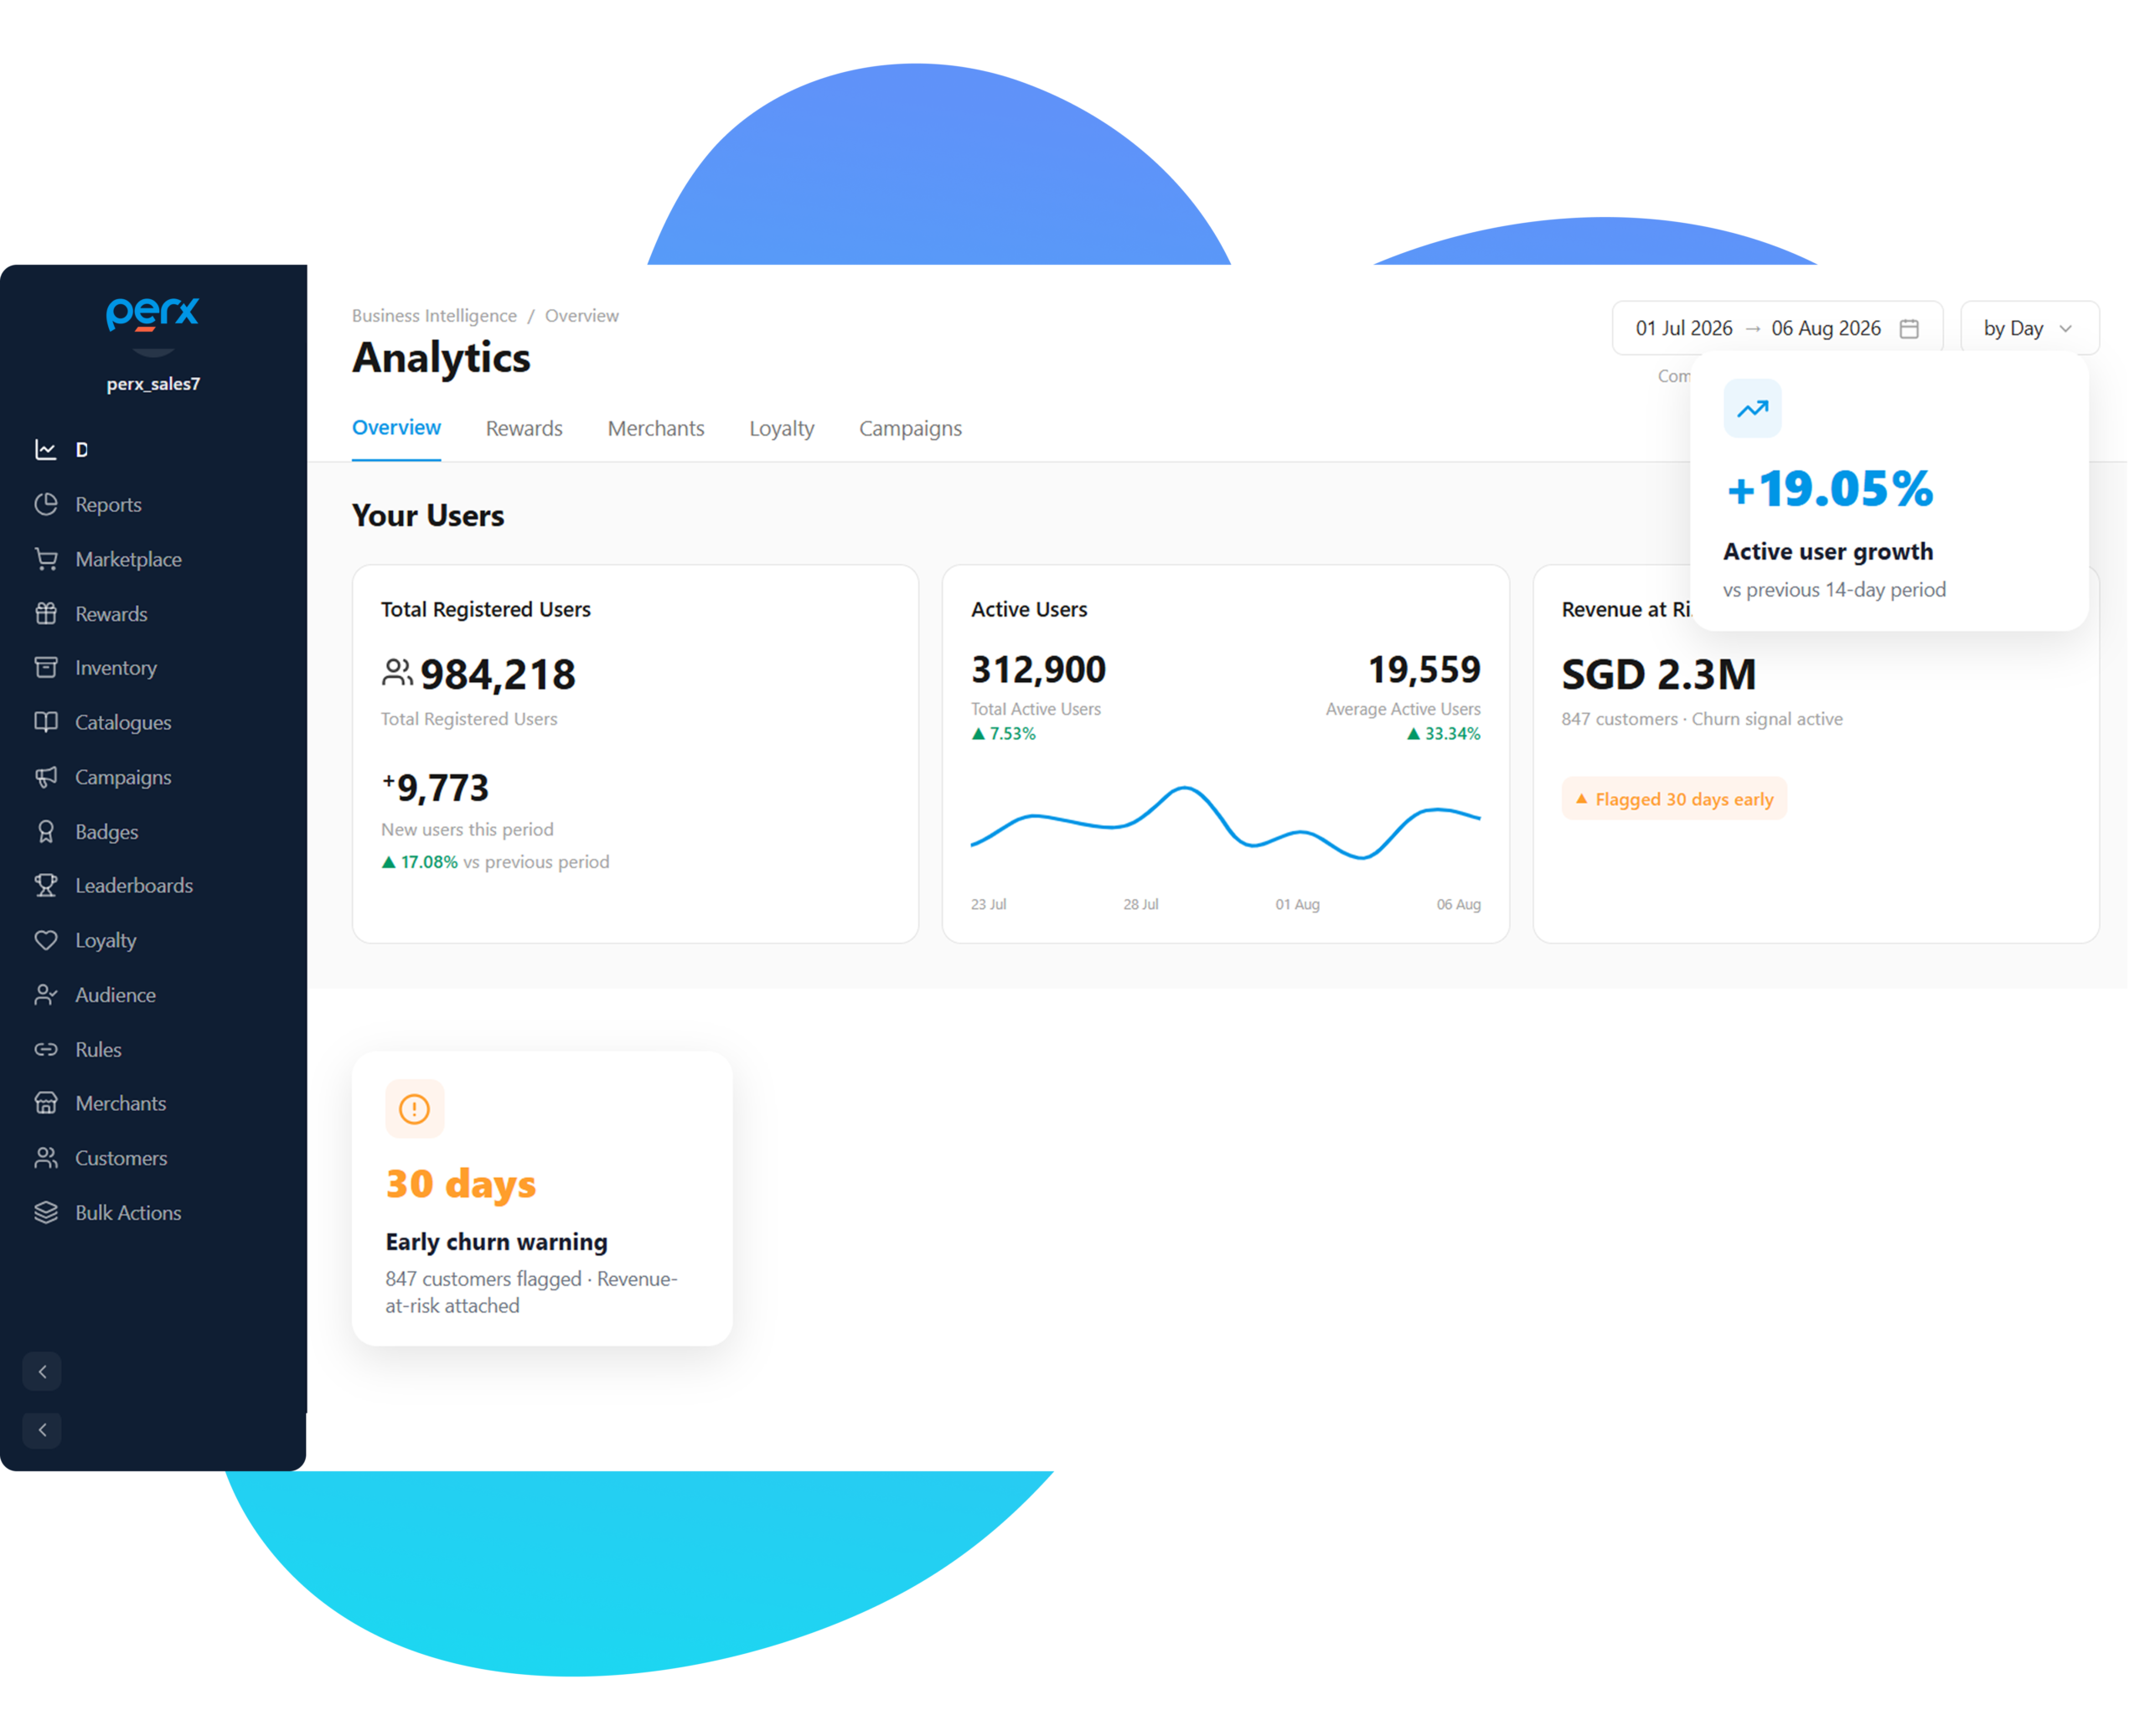
MAU and DAU tracked as forward-looking indicators of customer lifetime value. Declining trends trigger alerts with segment-level attribution so your team knows which cohort is losing engagement and why — before it becomes a board-level conversation.
Result: CLTV managed proactively — not diagnosed retrospectively

30 days

Proof point · Real-Time Dashboards · Churn Defensibility
Early warning on at-risk customers — with revenue-at-risk quantified, before lapse occurs
Insights Engine flags customers heading toward lapse up to 30 days before disengagement — giving retention teams the window to act while the customer is still recoverable, with the revenue-at-risk figure quantified so every intervention is prioritised by P&L impact, not gut feel.
Internal note: This is a platform capability specification. Confirm whether 30 days is a measured lead time from a client deployment or a platform design parameter before publishing.
Board-Ready Intelligence

The loyalty report every stakeholder
has always asked for
and never received.

Granular, touchpoint-level reports downloadable for deep-dive analysis — ensuring every cent of loyalty spend is auditable, attributable, and reconcilable with financial ledgers. Campaign attribution closes the loop from nudge fired to transaction completed, mapping every mechanic directly to a P&L line. Not just what happened. What caused it.
“The board does not want to see your open rate. They want to know which campaign drove which transaction, what the reward cost was per dollar of revenue generated, and whether the loyalty programme is a profit centre or a cost centre. Reports gives them that answer — in a format that belongs in a board deck, not a marketing review.”
Campaign Attribution Reports

Close the loop from nudge fired to transaction completed

Every campaign mechanic is tracked from the moment it fires to the transaction it influenced. The attribution logic maps each nudge — spin, streak, badge, quest — directly to the revenue event it caused. Every stakeholder from CMO to CFO sees a P&L line, not a campaign summary.
Result: Every loyalty mechanic mapped to a direct revenue outcome
Redemption & Reward Cost Reports

Know exactly what you spent and what it returned — per mechanic, per segment

Granular redemption reporting breaks down reward cost per customer, per segment, and per mechanic type. Over-deployed reward types surface immediately. The programme’s effective margin is visible at the campaign level, not just the annual budget level.
Result: Loyalty spend auditable to the individual transaction
Raw Data Export

For the data-hungry — every touchpoint, every interaction, downloadable

Touchpoint-level data exports give your data team the granular inputs needed for deep-dive analysis, custom modelling, and integration with existing BI tools. Every cent of loyalty spend is auditable and reconcilable with financial ledgers — no locked-in reporting dependency.
Result: Full data portability — integrate with any BI or data warehouse tool
MAU & Active User Reports

Structured active user reporting built for the board deck
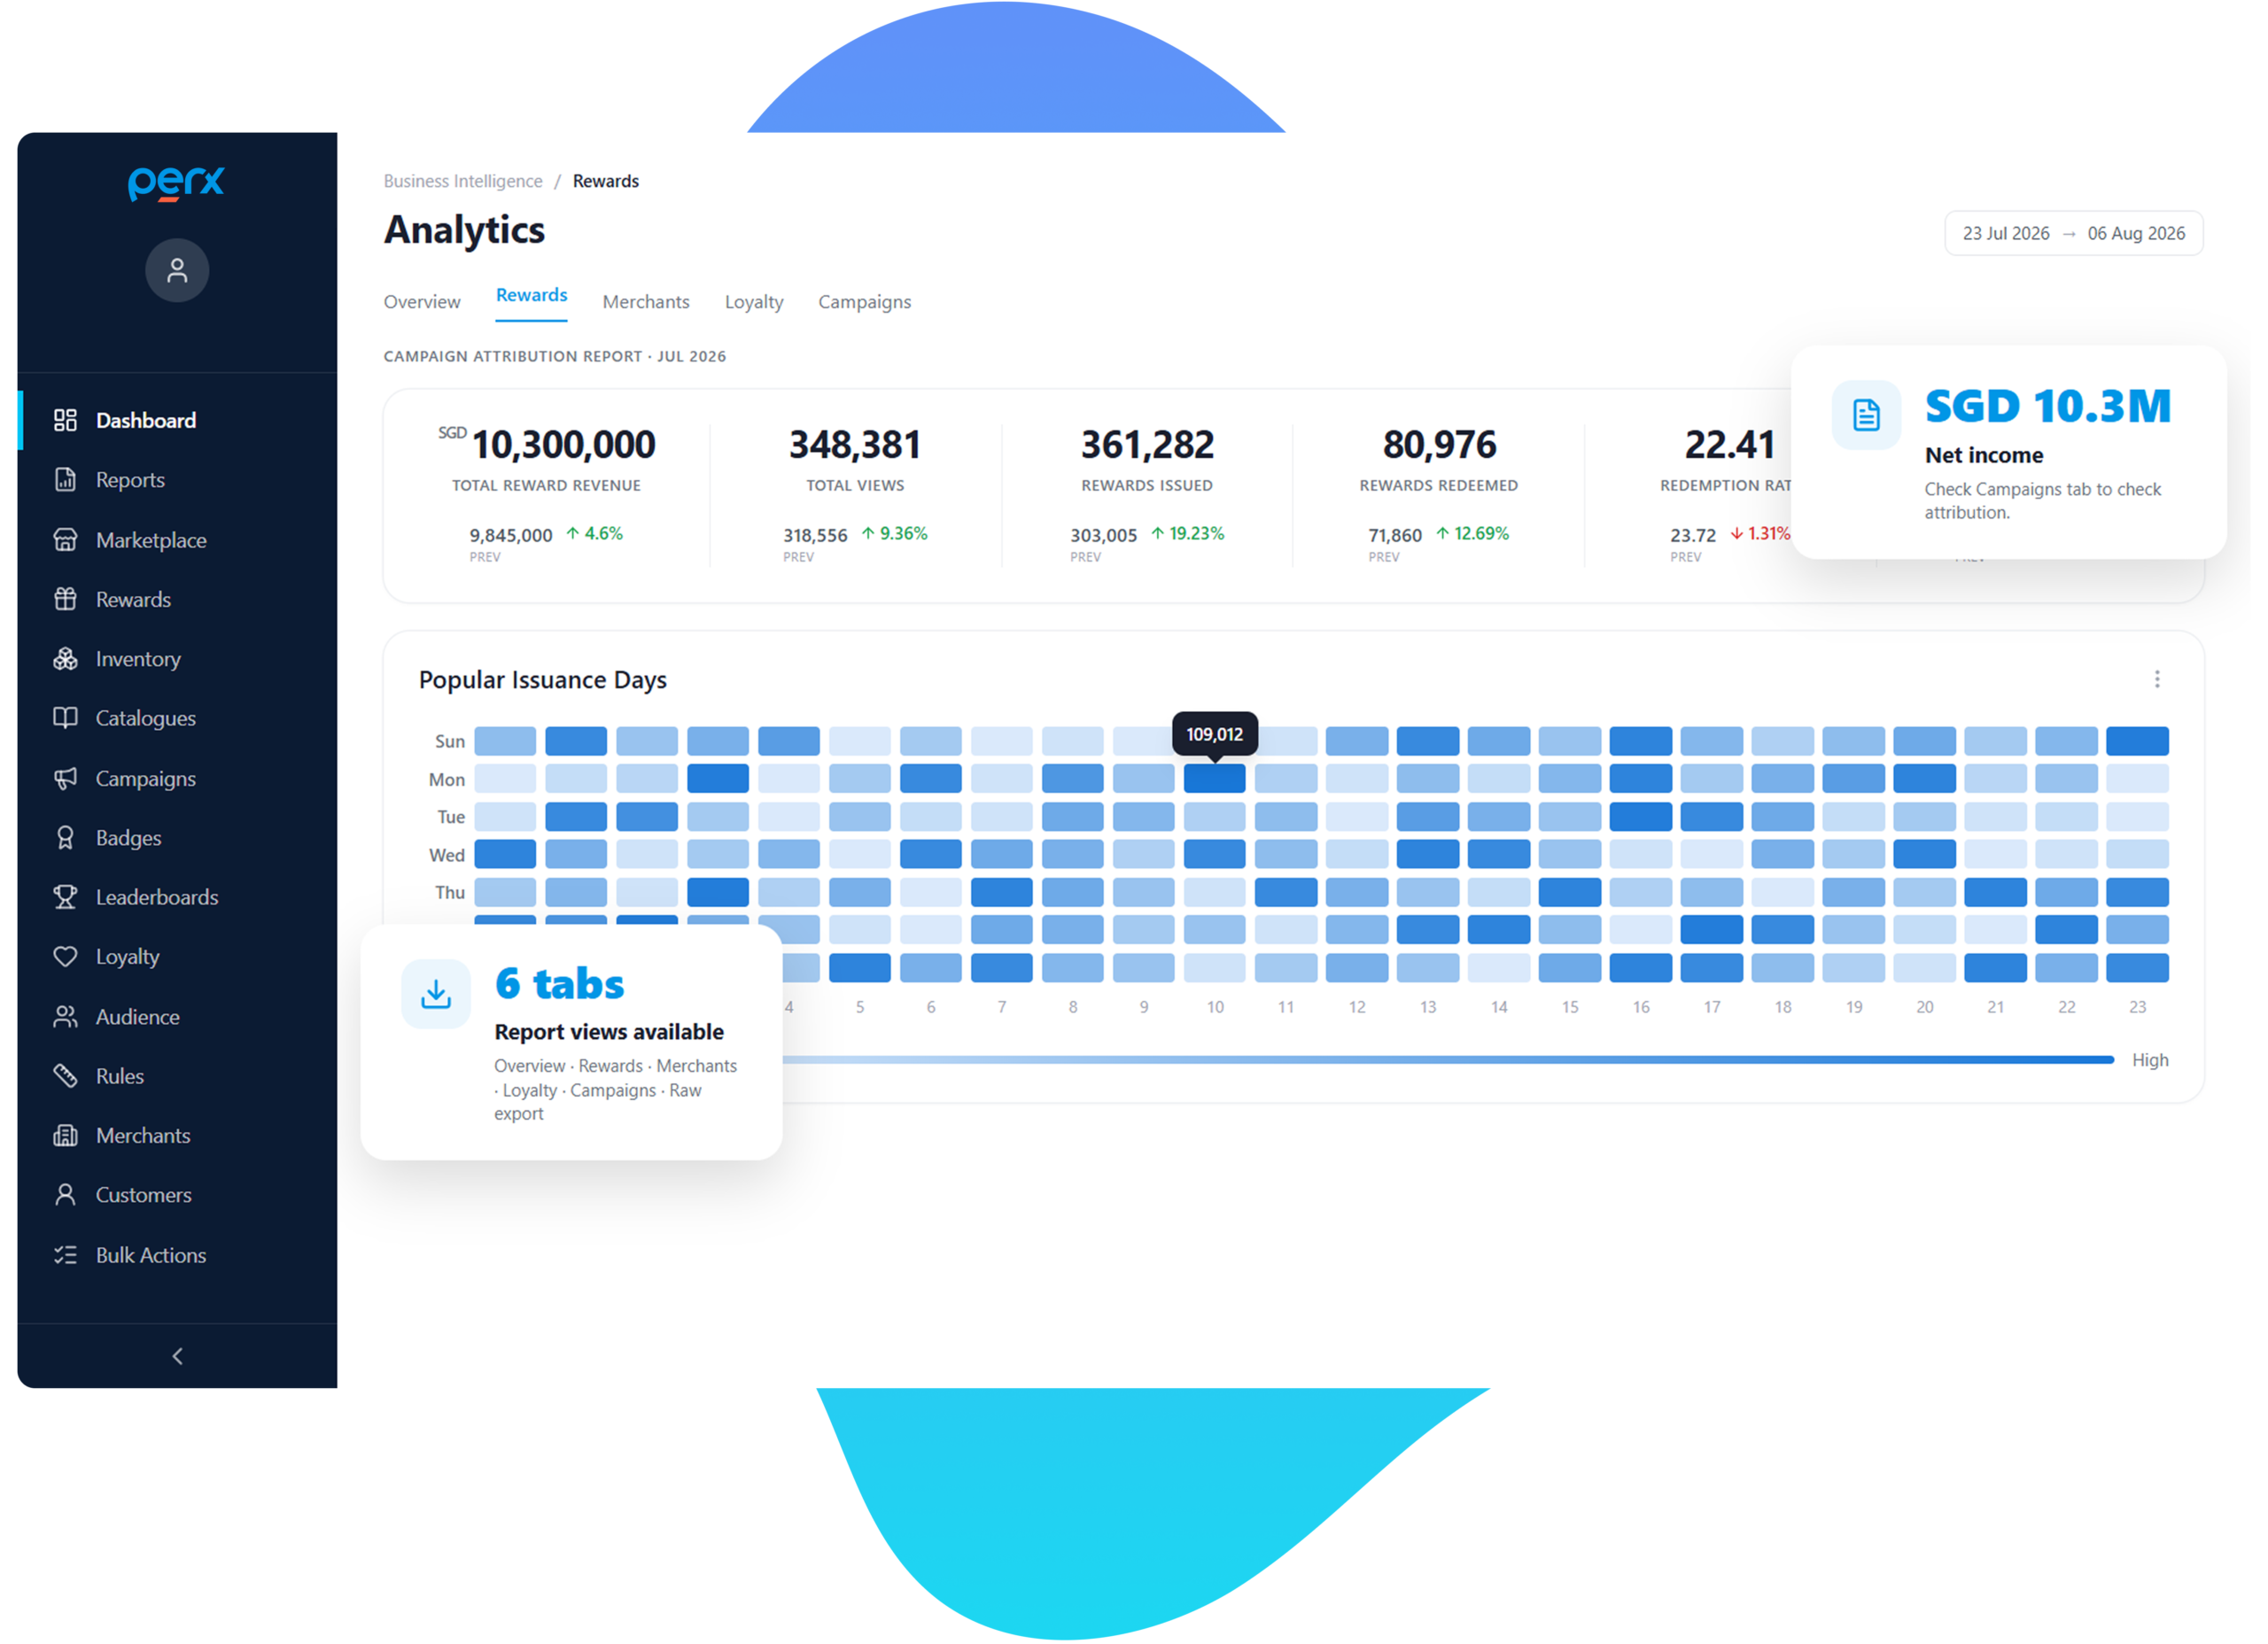
Formatted MAU, DAU, and retention trend reports built for the board presentation — not the analytics dashboard. Cohort-level breakdowns show which segments are growing, which are declining, and which campaigns drove the change — with attribution included.
Result: Board-ready active user narrative — attribution built in
Reports

$10M

Proof point · Reports · Platform-Wide Campaign Attribution
Net income generated across Perx-powered campaigns — every dollar traceable to a specific mechanic and segment
$10M in net income generated across Perx-powered campaigns — with every outcome traceable through attribution reporting to the specific mechanic, the specific segment, and the specific campaign that caused it.
Internal note: Platform-wide figure. Confirm whether attributable to the reporting capability specifically or to the broader platform — and whether a named client can be cited before publishing.
Premium · AI + Expert Intelligence

The pattern is in your data.
The AI finds it. Perx tells you
what to do with it.

Advanced Insights is a premium intelligence service where AI continuously analyses your programme data — identifying behavioural patterns, segment gaps, and reward inefficiencies in real time. Perx then interprets the findings, applies deep BFSI programme expertise, and builds the growth roadmap your internal team rarely has the bandwidth to surface alone. The output is not a dashboard to read. It is a structured, prioritised action plan to execute.
“AI can find the pattern. It takes programme expertise to know what the pattern means for your specific customer base, your specific market, and your specific P&L targets. Advanced Insights gives you both — continuous machine-speed analysis and human-level strategic interpretation — so the recommendation your team acts on is both data-precise and commercially sound.”
Metric-to-Profit Audits

Every KPI given a monetary value — and a named action to change it

Perx maps your existing programme metrics to their direct P&L consequences. Engagement rate becomes Transaction Lift. Redemption rate becomes Reward ROI. Active user trend becomes revenue-at-risk or revenue opportunity. Every metric exits the audit with a monetary value and a prioritised intervention your team can act on immediately.
Deliverable: Structured audit — not a report to interpret, an action plan to execute
Growth Opportunity Identification

Find the revenue hiding in your existing customer base — before a competitor does

AI continuously scans your programme data for untapped behavioural signals, underserved segments, and high-probability cross-sell moments. Perx evaluates which opportunities are commercially material for your specific context — and builds structured, prioritised recommendations your team acts on immediately.
Deliverable: Prioritised growth roadmap — ranked by revenue potential
Reward Efficiency Analysis

Know exactly where reward budget is over-deployed — with the reallocation already modelled

AI maps reward spend against behavioural impact across every mechanic, segment, and campaign. Over-rewarding surfaces as a named line item. Perx models the reallocation that achieves the same behaviour at lower cost — and validates it against your programme’s specific earn-burn dynamics before recommending it.
Proof: 0.6–2% reward cost of total transaction value — across optimised deployments
Next Best Offer Modelling

The right product, to the right segment, at the right moment — modelled, not guessed
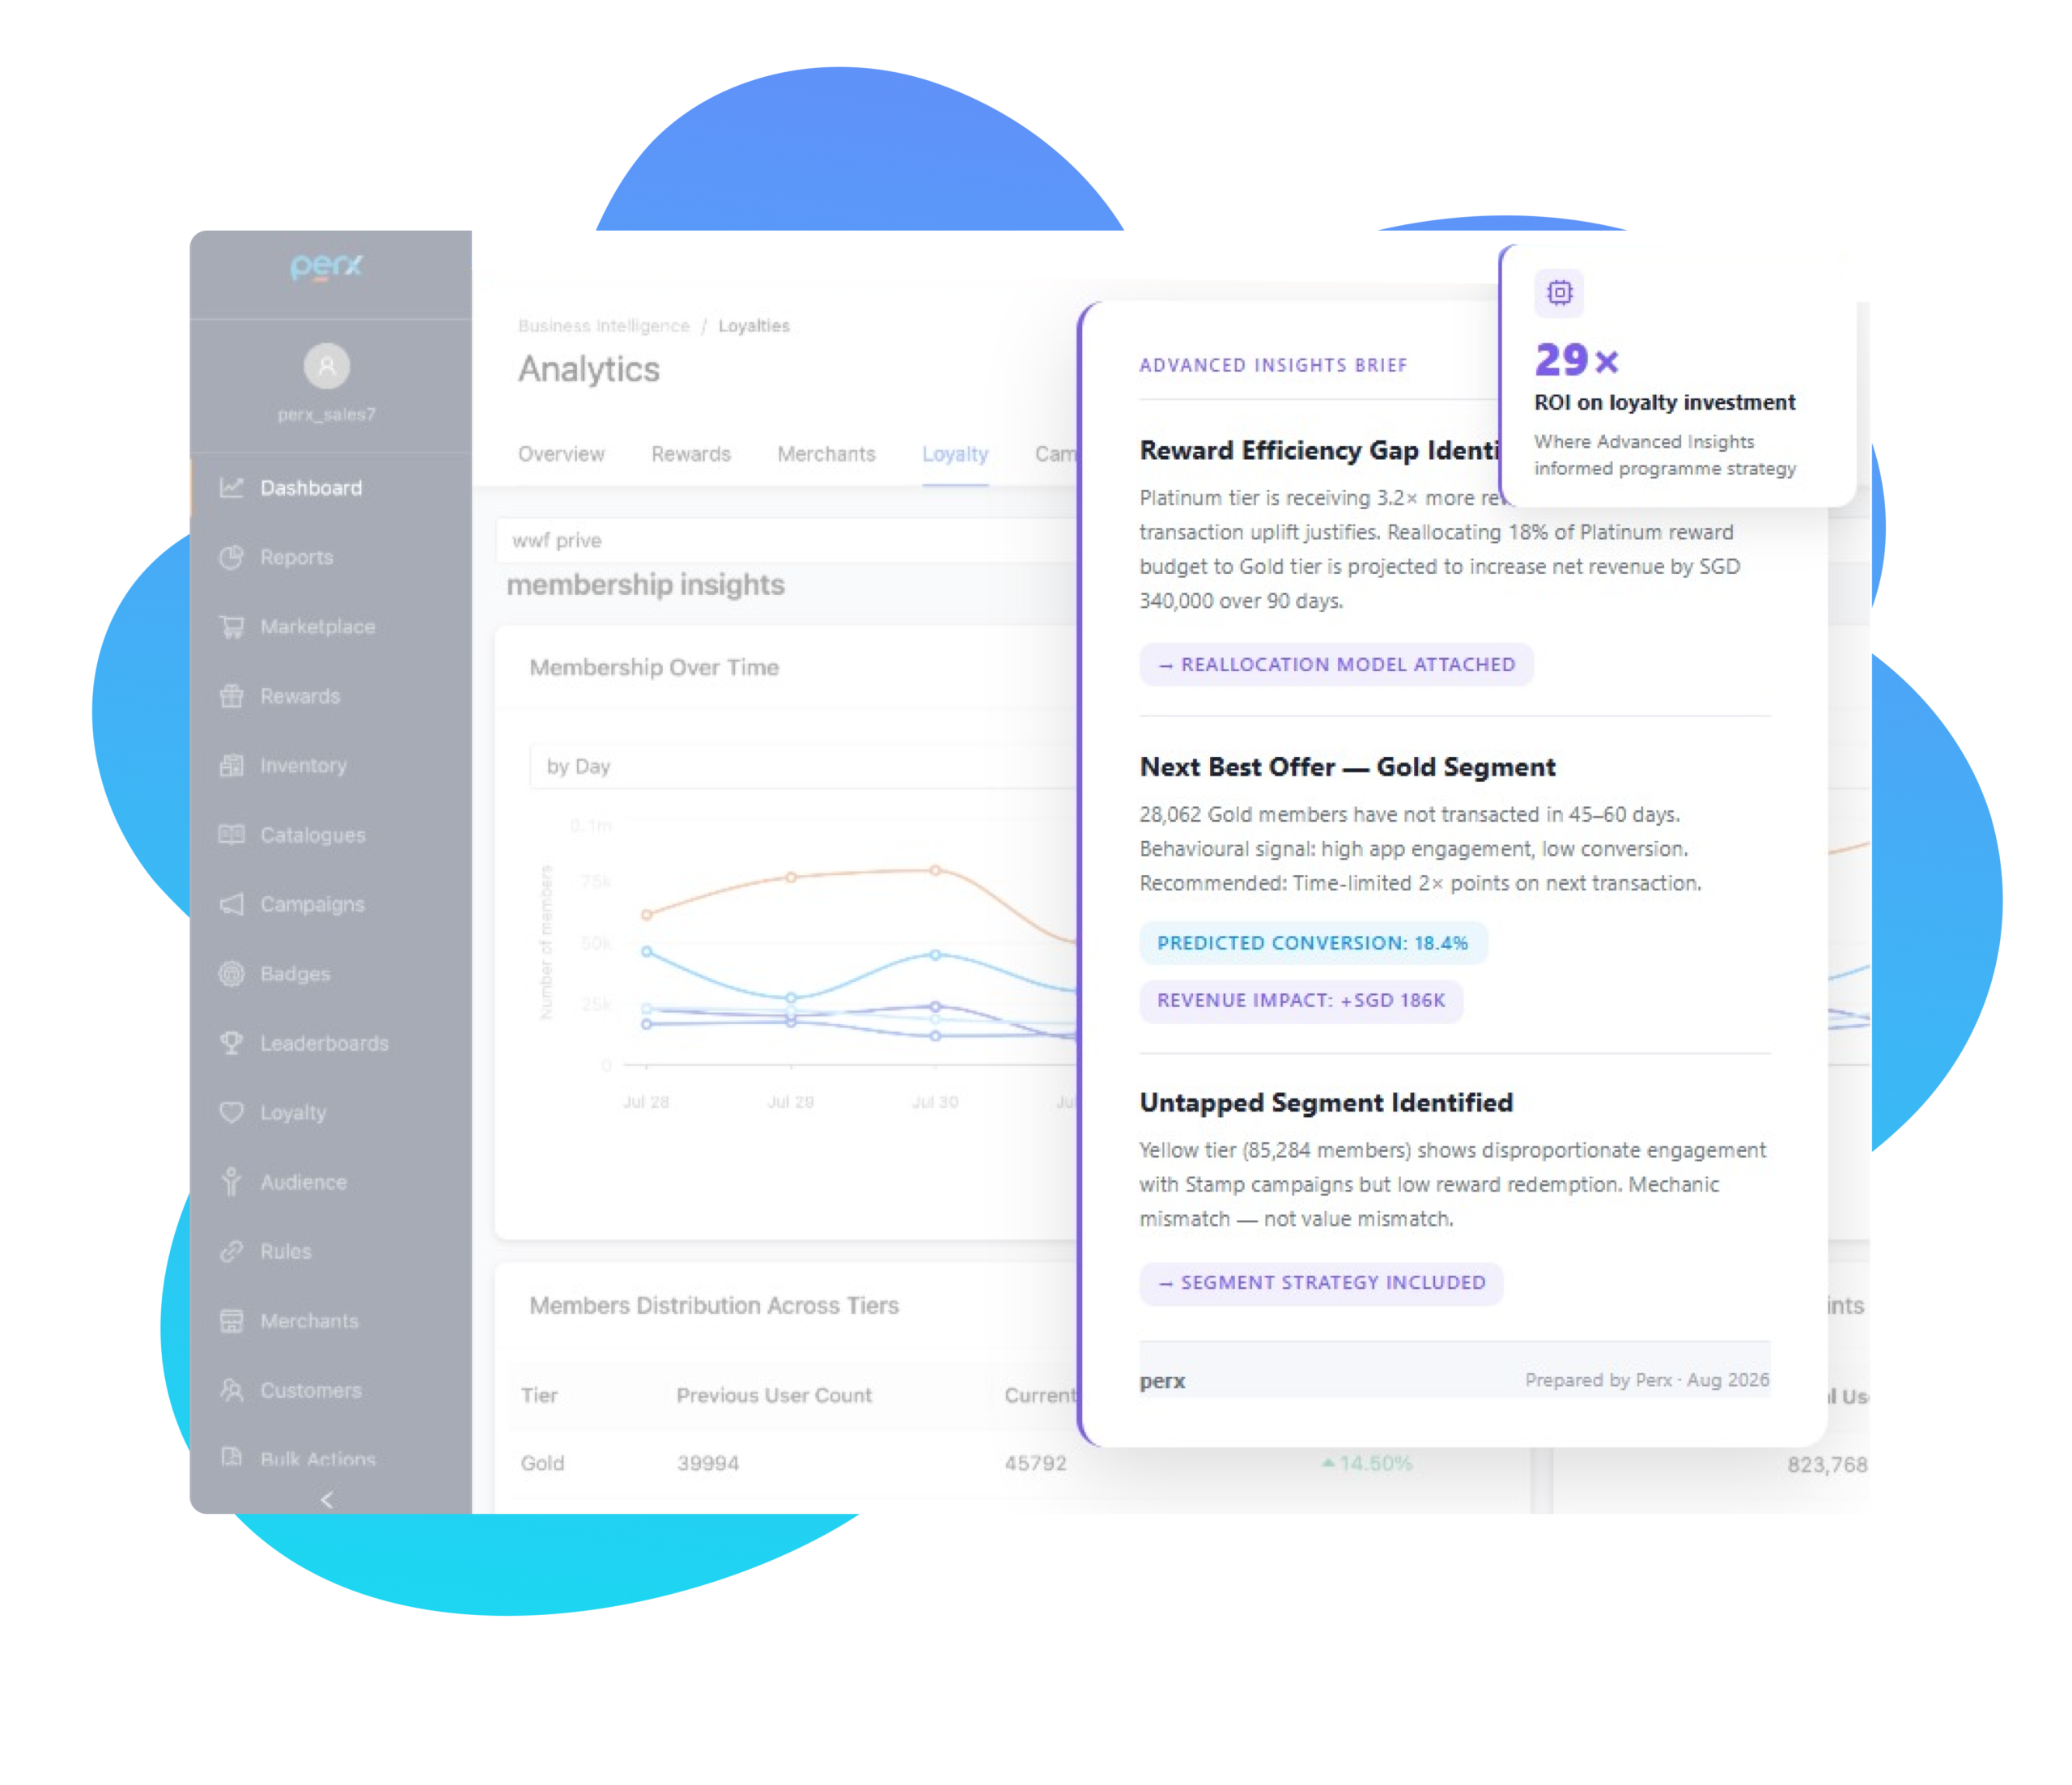
Behavioural and transaction signals are analysed to identify the highest-probability next product for each customer segment. Perx contextualises the model output against your product portfolio, customer lifecycle, and regulatory environment — then delivers a segment-level recommendation your team can execute immediately.
Deliverable: Segment-level next best offer — with timing and mechanic specified

29×

Proof point · Advanced Insights · Optimised BFSI Deployment
ROI on loyalty investment — where Advanced Insights informed the programme strategy
Across optimised deployments where Advanced Insights shaped the programme strategy — from reward efficiency to growth opportunity identification — Perx-powered BFSI programmes have delivered up to 29× ROI on loyalty investment.
Internal note: Sourced from Africa ICP doc in CFO persona context. Confirm whether this is a measured client outcome or a modelled ROI estimate before publishing. If confirmed, name the deployment context.
Margin Optimisation

The right reward. The right
moment.
Never a dollar over.

AI matches the right reward to the right customer at the right moment — blending points, vouchers, and game tries dynamically. Every interaction is met with an incentive of exactly equal psychological value. Maximum impact, minimum spend, zero manual calibration.
“Over-rewarding is as damaging as under-rewarding. A reward worth more than the behaviour it triggered costs you margin. Perx AI calibrates to psychological value — not arbitrary reward brackets.”
AI Reward Matching

Match reward value to psychological value — automatically

AI dynamically blends points, cashback, vouchers, and gamification tries to find the incentive of exactly equal psychological value for each customer action. No manual calibration. Maximum engagement per dollar spent.
Psychological driver: Variable Ratio Reinforcement
Multi-Category Reward Catalogue

Give customers choice without giving up margin control
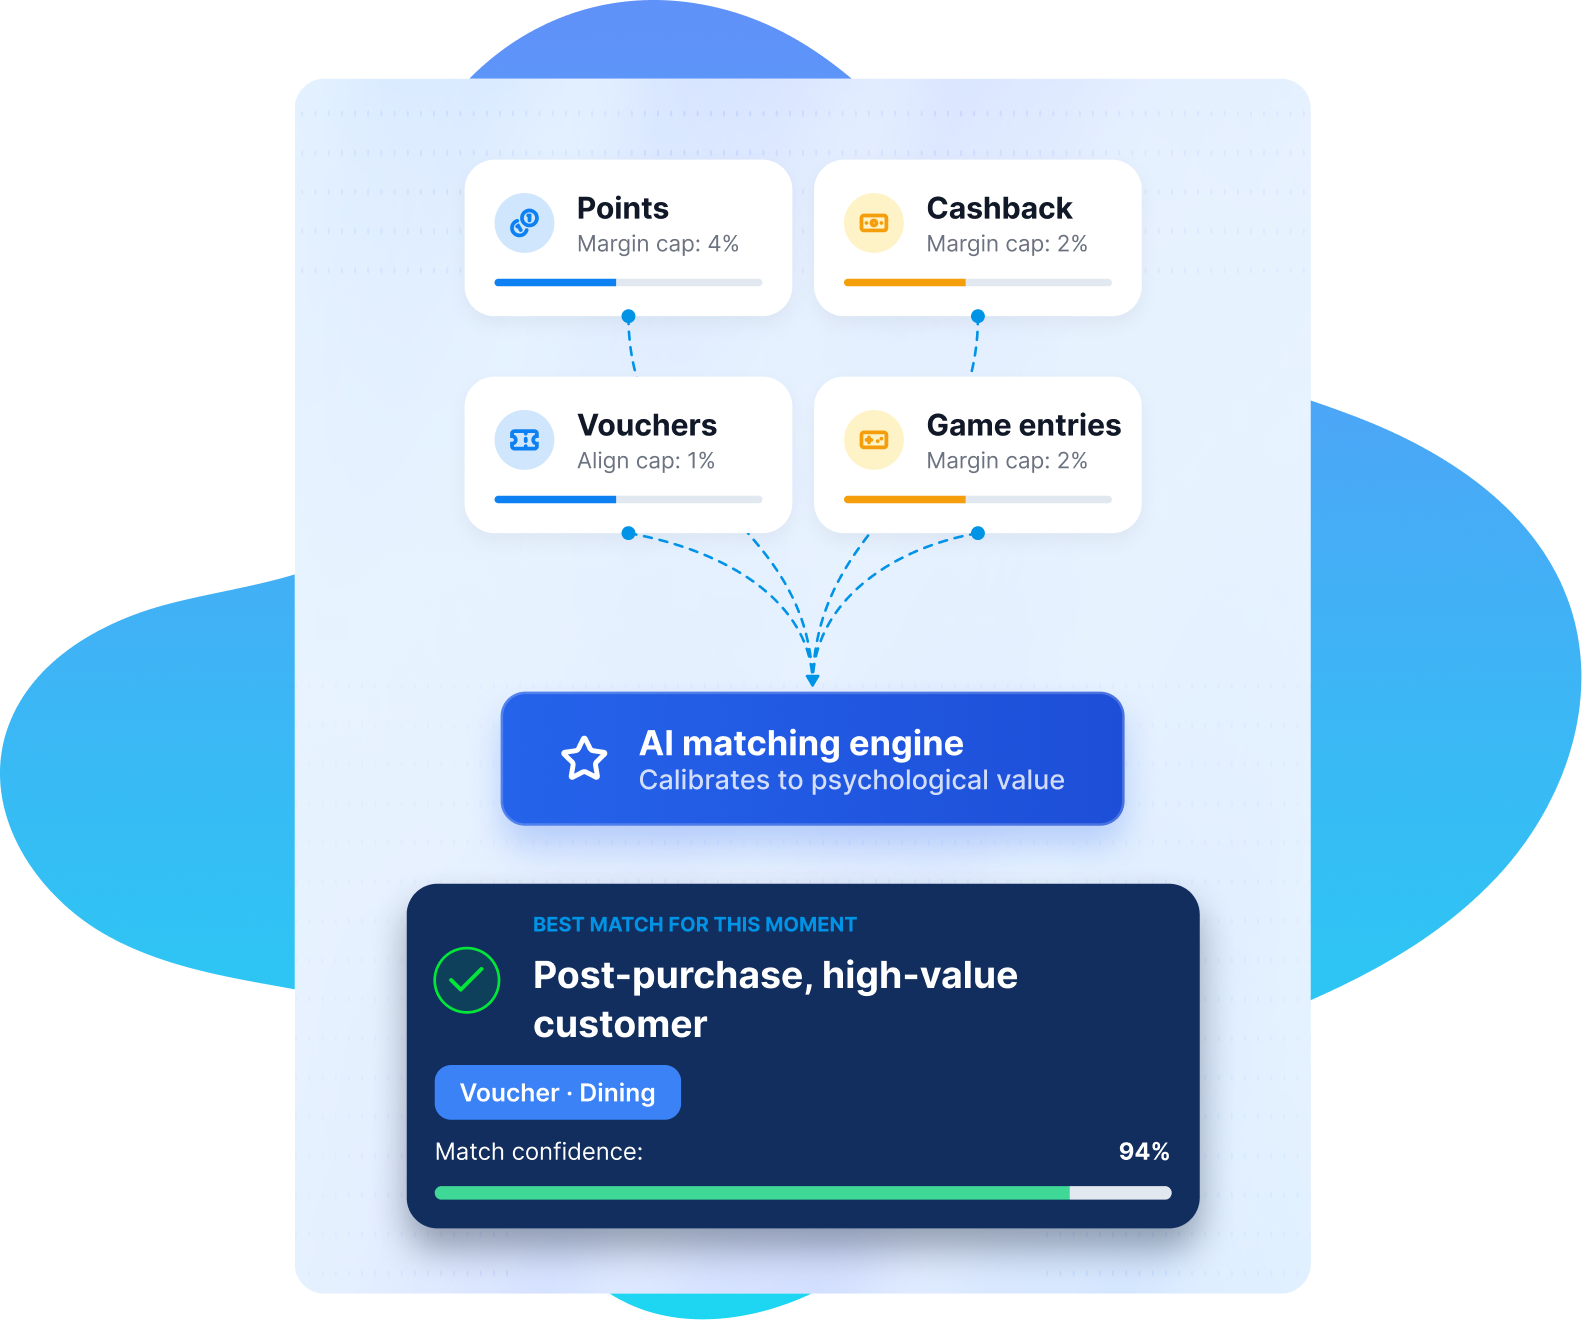
Points, vouchers, cashback, digital goods, game entries — all configurable in a single reward catalogue with individual margin controls per category. Customers feel richness of choice. You control every cost line.
Coverage: Points · Vouchers · Cashback · Game tries

$6.6M

Proof point · APAC · AI Reward Matching
Transaction value generated by matching the right reward to the right moment
AI reward matching generated $6.6M in transaction value — not by spending more on rewards, but by ensuring every reward issued was the one most likely to drive the next commercial action.
In the real world

Intelligence that shows up
on the P&L.

Every number traced to a specific mechanic, a specific deployment decision, a specific outcome.

Real-Time Dashboards · Churn Defensibility

30 days
Early warning on at-risk customers — with revenue-at-risk quantified, before lapse occurs.

Reports · Platform-Wide Campaign Attribution

$10M
Net income generated across Perx-powered campaigns — every dollar traceable to a specific mechanic.

Advanced Insights · Optimised BFSI Deployment

29×
ROI on loyalty investment — where Advanced Insights informed the programme strategy and reward efficiency.

Insights Engine · Revenue Intelligence · APAC

$10.3M
Direct net income generated across a leading APAC BFSI deployment — mechanics mapped directly to P&L.
Frequently asked
Questions buyers ask about InsightsEngine.
Backed by FAQPage schema — surfaced when buyers research loyalty analytics and intelligence platforms.

What is the Perx Insights Engine?

Perx Insights Engine is the intelligence layer of the Perx Loyalty Stack. It maps every loyalty mechanic — points, rewards, campaigns, and behavioural nudges — directly to a P&L outcome. Real-time dashboards surface what is driving revenue now. Attribution reports give every stakeholder from CMO to board a direct line from loyalty spend to net income. Advanced Insights (Premium) combines continuous AI analysis with Perx’s programme expertise to turn data into a structured, prioritised growth roadmap.

How does Insights Engine help prevent customer churn?

The Churn Defensibility signal flags at-risk customers up to 30 days before lapse — with a revenue-at-risk figure attached. Your retention team is prioritised by P&L impact, not recency of last login. The difference between reactive churn management and proactive retention is 30 days of signal — and knowing which customers are worth the intervention in revenue terms.

What loyalty metrics does Insights Engine track?

Insights Engine tracks Transaction Lift (direct revenue increase attributable to each campaign), Redemption ROI (return per dollar of reward issued), Churn Defensibility (at-risk signals with revenue-at-risk figure attached), MAU and DAU trends (active user growth as a CLTV indicator), and Campaign Attribution (nudge to transaction, fully closed-loop). All metrics are mapped to P&L outcomes, not engagement scores.

What is Advanced Insights and who is it for?

Advanced Insights is a premium intelligence service combining continuous AI analysis with Perx’s programme expertise. The AI scans your programme data in real time — identifying behavioural patterns, segment gaps, and reward inefficiencies. Perx then contextualises the findings against your specific market, customer base, and P&L targets — delivering Metric-to-Profit Audits, Growth Opportunity Identification, Reward Efficiency Analysis, and Next Best Offer Modelling. It is designed for BFSI enterprises who need not just the signal, but the strategic interpretation and the executable action plan to act on it.

How does Insights Engine integrate with existing BI tools?

Raw data exports at the touchpoint level give your data team the granular inputs needed for integration with existing BI tools, data warehouses, and custom modelling environments. Every data point is exportable, auditable, and reconcilable with financial ledgers — with no locked-in reporting dependency.
Also in this product

Anomaly Detection

Unusual patterns flagged before your team spots them — with recommended action attached.

Growth Opportunity Identification

The next significant CLTV or revenue uplift surfaced from existing programme data — with prioritised recommendations.

Reward Efficiency Analysis

Where budget is over-deployed relative to behavioural impact — with reallocation recommendations.

Cohort Behaviour Mapping

How customer segments evolve across acquisition, activation, engagement, and retention — with mechanic attribution at each stage.

Built for BFSI compliance

Intelligence your board, compliance team, and finance function all rely on.

Every data access, every export, and every attribution report is governed, auditable, and reconcilable with financial ledgers — from day one.

ISO/IEC 27001 & 27018

Certified. Every data access and export auditable from day one.

GDPR compliant

Zero & first-party data by design. No third-party data dependency.

Financial-grade attribution

Every mechanic mapped to a P&L line — auditable and reconcilable with financial ledgers.

Raw data portability

Full touchpoint-level export — no locked-in reporting dependency.

RBAC data access controls

Granular permission settings define which teams can access which data.

Board-ready reporting

Formatted for the board deck — not the analytics dashboard.

Explore other engines in the

Perx Loyalty Stack

AI-Powered
You are here

AI-Powered

Orchestrate revenue. Not just campaigns.

AI-Powered

From earn-and-burn to earn-and-belong.

See Insights Engine in action.

30 minutes. We’ll show you the live dashboard, the attribution reports, and what your current loyalty data would tell you — if you had the intelligence layer to read it.
Loyalty Engagement Platform Built for the Mobile-first Economy
Privacy Overview

This website uses cookies so that we can provide you with the best user experience possible. Cookie information is stored in your browser and performs functions such as recognising you when you return to our website and helping our team to understand which sections of the website you find most interesting and useful.