
Tier 1 Engagement Audit: 3 Loyalty Leaks Draining Your BFSI Stack


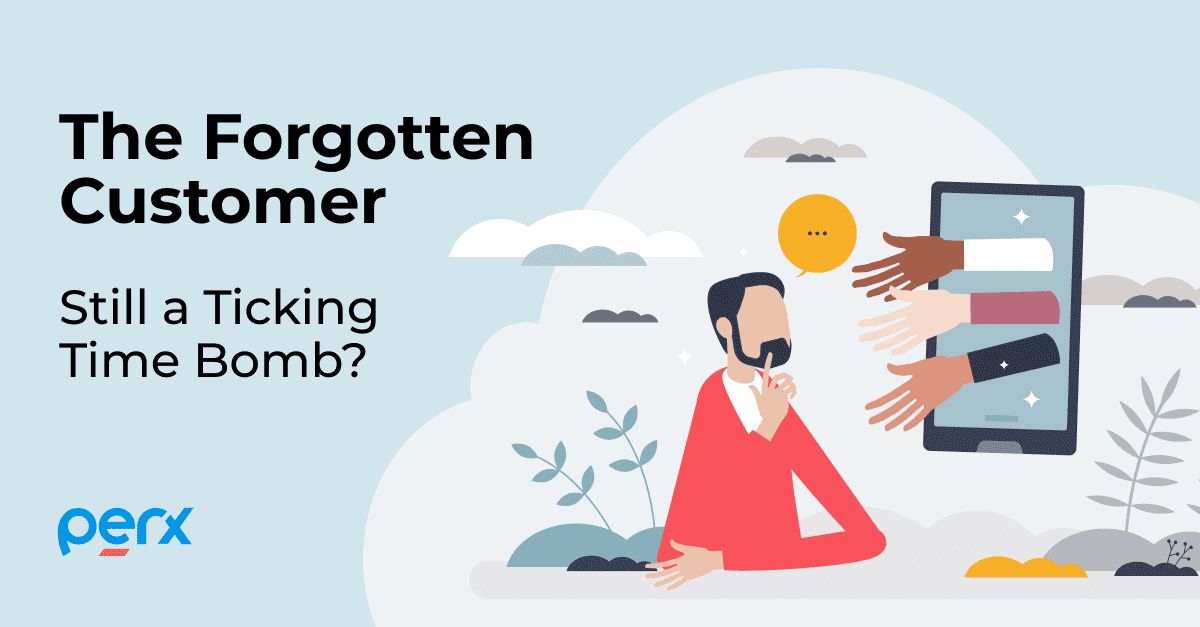
The Tier 1 Engagement Audit: 3 Loyalty Leaks We Find in Every Legacy Stack

What Is a Tier 1 Engagement Audit?
It’s not a product demo. It’s not a feature comparison. It’s a P&L-first analysis of your engagement stack, covering:
- Behavioral data patterns: where customers drop off the engagement loop
- Incentive efficiency: the ratio of reward spend to revenue-generating behavior
- Platform velocity: how long it takes to go from campaign idea to live customer journey
- Churn signals: the behavioral precursors to attrition that most dashboards miss
Loyalty Leak #1 - The Static Points Trap (Earn-and-Burn Without Behavioral Lock-In)
What it looks like
Your program rewards transactions. Customers earn points. Some redeem. Most don’t engage beyond the basic earn cycle. Your redemption rate is decent on paper, but app opens, cross-sell conversion, and product adoption haven’t moved.
This is the Static Points Trap, a program designed around financial utility rather than behavioral psychology.
Why it happens
Legacy loyalty platforms were engineered to manage point ledgers, not engineer habits. They track what customers did, not why, and they offer no mechanics to influence the next action. The result: a functional points economy with zero psychological pull.
The Octalysis Framework, a behavioural psychology model underpinning the most effective gamification strategies in loyalty today, identifies Loss Aversion, Epic Meaning, and Unpredictability as the three most powerful drivers of sustained daily habit. Standard earn-and-burn programs activate none of them.
Understanding how this works at a psychological level matters. The Dopamine Domino Effect – the chain reaction of small wins that keeps customers habitually engaged – is exactly what static points programs fail to trigger.
What to look for in your own stack
Run this self-check:
- Does your program reward non-transactional behaviors (app logins, profile completion, quiz engagement)?
- Do you have multi-dimensional tiers that reward total relationship value — not just spend?
- Can customers see a progress bar toward their next reward or tier milestone?
- Do you have streak mechanics that create a psychological cost to breaking engagement?
If the answer to any of these is “no” or “our platform can’t do that,” you have Loyalty Leak #1.
The fix: Replace static earn-and-burn with a behavioral points architecture. This means rewarding micro-engagements, deploying streak and milestone mechanics, and building tiering systems that create genuine loss aversion.
What it costs you
- Flat MAU: Customers have no reason to open your app except to transact. No habit, no daily engagement, no cross-sell opportunity.
- Low CLTV uplift: Without tiering mechanics that create psychological lock-in, your highest-value customers are just as likely to leave as your lowest.
- Wasted acquisition cost: You spend to acquire a customer, activate them into the points program, and then lose them to inertia.
A digital bank we work with had a points program running for three years. When we ran the engagement audit, we found that fewer than 12% of enrolled customers had interacted with the program in the past 90 days. The fix wasn’t more points; it was adding Daily Streaks, Progress Bars, and Tier Status mechanics that created loss aversion around earned status. Within two quarters, their returning customer rate reached 72%. The mechanics behind that shift are covered in detail in our best practices for engagement gamification guide.
Loyalty Leak #2 - The IT Bottleneck Tax (Campaigns That Take Months, Not Hours)
What it looks like
Your marketing team has a campaign idea. It requires a new rule – maybe a double-points weekend for a specific product segment, or a flash quest tied to a payment milestone. The idea goes into the IT backlog. Six weeks later, it launches – after the moment has passed.
This is the IT Bottleneck Tax – and it’s one of the most expensive leaks in enterprise BFSI loyalty programs. You’re paying for it in missed market moments, stale campaigns, and a marketing team that has quietly stopped trying to innovate.

Why it happens
Legacy loyalty platforms were built for IT teams, not marketing teams. Campaign logic is hardcoded or requires developer intervention to modify. Rules engines – if they exist – operate at the transaction level with limited metadata support. Launching a new campaign means a change request, a development sprint, a QA cycle, and a deployment window.
The gap between “market opportunity” and “live campaign” is measured in months.
What it costs you
- Missed revenue windows: Seasonal moments, competitor moves, and customer lifecycle events require real-time response. A 6-week IT cycle makes all of them irrelevant.
- Over-reliance on batch campaigns: When speed is impossible, teams default to scheduled, broadcast campaigns — the bluntest possible instrument for behavioral change.
- Marketing team attrition: The best growth marketers leave environments where their ideas die in Jira queues. You lose institutional knowledge and momentum simultaneously.
In competitive APAC markets – where mobile-native customers respond to “surprise and delight” moments in real time – the IT Bottleneck Tax is a direct competitive disadvantage. A challenger bank with a modern engagement stack can respond to a competitor’s pricing change with a targeted behavioral campaign in hours. A legacy-stack incumbent responds in quarters.
The math is stark: if your platform constrains you to six campaign launches per year, and a modern stack enables 60+, you are operating at 10% of your potential engagement velocity. The rules engine is the core enabler here – how a precision rules engine creates the ultimate customer journey walks through exactly how granular event-driven logic changes what’s possible for marketing teams.
What to look for in your own stack
- How long does it take from campaign brief to live campaign – honestly?
- Can your marketing team change campaign rules without an IT ticket?
- Does your rules engine support granular transaction metadata (merchant category, amount thresholds, channel, time-of-day)?
- Can you A/B test incentive mechanics in real time without engineering involvement?
If your answer to #2 is “no,” you have Loyalty Leak #2, and you’re paying the IT Bottleneck Tax on every campaign you run.
The fix: The architectural solution is a headless, API-first campaign orchestration layer that decouples loyalty logic from core banking infrastructure. Marketers should be able to build, test, and launch complex campaigns with zero code – including real-time rule adjustments mid-campaign.
Loyalty Leak #3 - The Vanity Metrics Blindspot (Dashboards That Don't Speak P&L)
What it looks like
You have a dashboard. It shows enrolled members, points issued, redemptions, and maybe an app engagement rate. Your QBR deck is full of these numbers. Your CMO presents them to the board.
But when the CFO asks “how much revenue did the loyalty program generate last quarter?” – there’s silence, or at best, a correlation story that nobody fully believes.
This is the Vanity Metrics Blindspot – the gap between engagement data and financial proof. And it’s the leak that threatens the program’s budget every single year.

Why it happens
Most loyalty platforms were built to operate programs, not to justify them. Their reporting layers track program mechanics (points issued, vouchers redeemed, tier movements) but have no native connection to financial outcomes (transaction lift, NPS-to-revenue correlation, churn-prevented CLTV, cross-sell conversion by segment).
The result: loyalty leaders speak in “engagement” while CFOs speak in “currency” – and the conversation never fully connects. The internal politics this creates – and how to navigate them – are covered in loyalty program internal politics and ROI, one of the most practically useful reads for anyone trying to protect a loyalty budget.
What it costs you
- Budget vulnerability: Without a direct P&L bridge, loyalty programs are perpetually at risk of being cut or underfunded. They’re treated as cost centers, not revenue drivers.
- Wrong optimization signals: If you’re optimizing for redemption rate instead of transaction lift or CLTV expansion, you’re tuning the wrong metric – and you may be over-rewarding unprofitable behavior.
- Missed churn prevention: The behavioral signals that predict churn (declining login frequency, reduced transaction velocity, dropped streak) are invisible in points-ledger dashboards – until the customer is already gone.
One enterprise we audited was spending heavily on a cashback program that showed strong redemption numbers. When we ran a Metric-to-Profit Attribution analysis — mapping specific mechanics to financial outcomes — we found that 60% of the cashback budget was flowing to a customer segment with zero incremental transaction lift. The spend was rewarding behavior that would have happened anyway.
Reallocation to behavioral nudges (streaks, quests, milestone rewards) targeting mid-tier segments generated $6.6M in incremental transaction value in the following two quarters. The framework for transforming engagement metrics into ROI is the methodology that makes this reallocation defensible to finance teams.
What to look for in your own stack
- Can you directly attribute a specific campaign mechanic to a revenue outcome (transaction lift, product adoption, churn prevention)?
- Do you have cohort-level behavioral data – not just aggregate engagement metrics?
- Can you identify at-risk segments before they churn, based on behavioral signals?
- Does your reporting distinguish between additive customer behavior (new transactions triggered by the program) and subsidized behavior (rewarding what customers would have done anyway)?
If your dashboard can’t answer these questions, you have Loyalty Leak #3, and your program’s budget will always be a political negotiation rather than a business case.
The fix: Replace vanity dashboards with a Metric-to-Profit attribution layer, direct mapping of engagement mechanics (streaks, quests, points) to hard financial outcomes like Interest Income, Policy Renewal rates, and GMV lift. This is the difference between having “data” and having “alpha.”
The Compound Effect - Why These Three Leaks Reinforce Each Other
The three loyalty leaks rarely travel alone. In legacy BFSI stacks, they compound.
A program without behavioral mechanics (Leak #1) generates flat engagement data, which makes Leak #3’s Vanity Metrics Blindspot harder to fix because there’s nothing meaningful to measure in the first place. Meanwhile, the IT Bottleneck (Leak #2) prevents the team from running the experiments that would generate the behavioral signal needed to build a P&L case.
The result is a doom loop: no behavioral architecture → no meaningful engagement → no financial attribution → no budget to fix the platform → no behavioral architecture.Breaking the loop requires addressing all three leaks in sequence:
- Rebuild the behavioral foundation – move from static points to psychology-led engagement mechanics
- Remove the IT dependency – give marketing teams a no-code campaign orchestration layer that runs at market speed
- Connect engagement to the P&L – replace vanity dashboards with financial attribution that makes the loyalty program’s ROI undeniable
This is the audit framework we apply to every enterprise engagement stack. It’s also the architecture Perx was built to deliver, specifically for the compliance, scale, and data complexity of BFSI.

What a Fixed Engagement Stack Looks Like - Benchmarks from the Field
To calibrate what “good” looks like, here are performance benchmarks from BFSI engagement programs running on modern behavioral stacks:

| Metric | Legacy Stack Baseline | Modern Behavioral Stack |
|---|---|---|
| Monthly Active Users (MAU) | 8–15% of enrolled base | 55%–75% of enrolled base |
| Campaign launch time | 4–8 weeks | Same day to 48 hours |
| Returning customer rate | 40–55% | 65–75%+ |
| Engagement-to-revenue attribution | None / proxy metrics | Direct P&L bridge |
| Churn prediction lead time | Reactive (post-churn) | 30–60 days predictive |
| Incentive waste (subsidized behavior) | 40–60% of reward budget | <20% with rules-engine precision |
How to Conduct Your Own Tier 1 Engagement Audit - A Starter Framework
Step 1: Behavioral Architecture Audit (Leak #1)
- Map every mechanic in your current program to a specific behavioral psychology principle
- Identify what percentage of your enrolled base has engaged with a non-transactional mechanic in the past 90 days
- Run a cohort analysis: do customers with tier status have measurably higher CLTV than those without?
Step 2: Platform Velocity Audit (Leak #2)
- Log your last five campaign launches: what was the time from brief to live?
- Count how many campaign modifications required an IT ticket in the past quarter
- Identify three campaign ideas your team didn’t pursue because of platform constraints
Step 3: Financial Attribution Audit (Leak #3)
- Pull your top 3 campaigns by engagement metric — then ask: what was the incremental transaction lift for each?
- Segment your reward spend by customer cohort: which segments show additive behavior vs. subsidized behavior?
- Calculate your incentive cost-per-incremental-transaction for each major mechanic
In Conclusion
Ready to find your loyalty leaks?
FAQs:
What is a loyalty program audit and what does it cover?
- whether the program uses behavioral psychology mechanics — not just points — to create customer habit and retention;
- how quickly marketing teams can launch, modify, and test campaigns without IT dependency; and
- whether engagement metrics are directly connected to financial outcomes like transaction lift, CLTV, and churn prevention. The goal of an audit is to identify “loyalty leaks” — systematic revenue and engagement losses caused by legacy platform constraints or misaligned incentive architecture.
What are the most common problems with legacy loyalty programs in banking?
- Static earn-and-burn mechanics that reward transactions but fail to build daily engagement habits, resulting in low Monthly Active Users and flat CLTV growth;
- IT-dependent campaign infrastructure that creates 4–8 week lag times between campaign ideas and live deployment, causing teams to miss market moments and default to blunt broadcast campaigns; and
- Vanity metric dashboards that track program mechanics (points issued, redemptions) without connecting engagement data to financial outcomes — leaving CFOs unconvinced of the program’s ROI and making budget allocation a political exercise rather than a business case.
How do you measure ROI from a loyalty program?
What is behavioral loyalty and how is it different from traditional points programs?
How long does it take to migrate from a legacy loyalty platform?
What behavioral mechanics actually improve customer retention in BFSI?
- Daily Streaks — creating a psychological cost to breaking engagement, shown to sustain 70%+ returning customer rates in digital banking contexts;
- Progress Bars and Milestone Rewards — leveraging the Goal Gradient Effect, where engagement accelerates as customers approach a milestone;
- Multi-Dimensional Tier Systems — creating Elite Identity and Loss Aversion that makes switching to a competitor feel like a personal demotion;
- Gamified Onboarding Quests — reducing friction on high-value but low-engagement actions like KYC completion, profile setup, or first direct debit setup; and
- Social Referral Mechanics — converting loyal customers into organic acquisition channels, shown to drive 90% surges in digital signups in APAC markets.
Recommended for you

Blogs

Blogs
Sustainability

Blogs
Blogs


