
An ISO/IEC27001:2013 and ISO 27018:2019 certified cloud solution

IN BRIEF
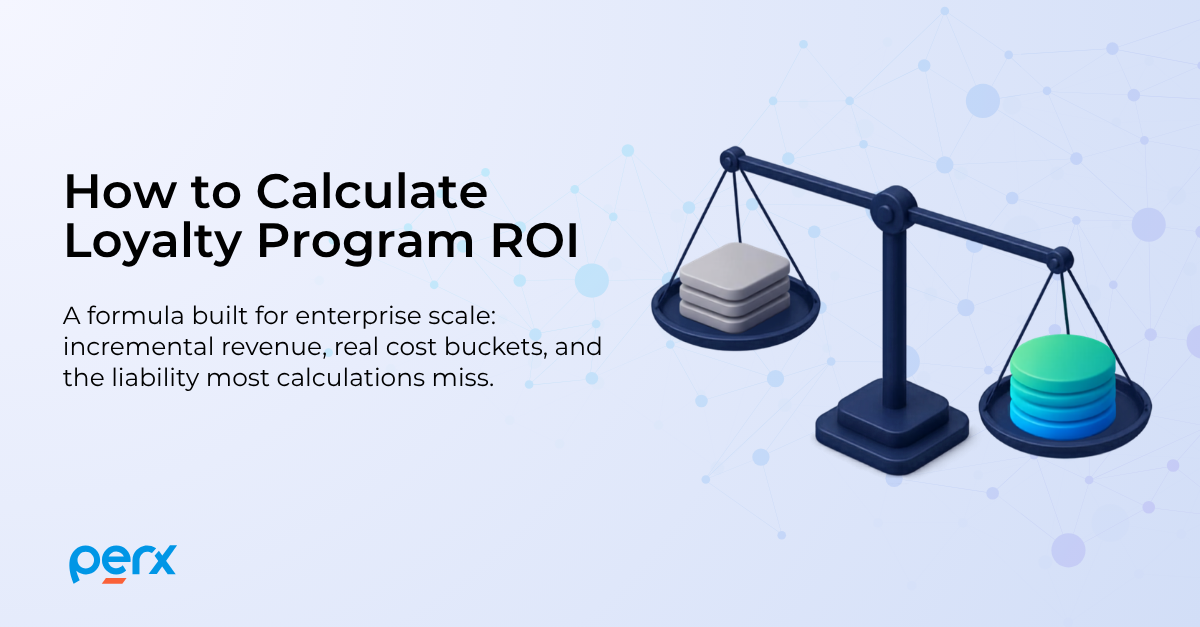
Loyalty program ROI is the number a CFO asks for before renewing next year’s budget, and it is also the number most marketing teams struggle to defend. Calculating it looks simple on paper: subtract cost from revenue, divide by cost. In practice, most teams get the formula right and the inputs wrong. They count total member revenue instead of incremental revenue, they leave out the people and compliance cost of running the program, and they never account for the points sitting on the balance sheet as an unfunded liability. For an enterprise BFSI or telco program running across millions of customers and multiple regulatory jurisdictions, those gaps compound fast. Here is a formula built for that scale, not for a single Shopify storefront.
Loyalty program ROI is the ratio between what a loyalty program returns to the business and what it costs to run, expressed as a percentage. A program with 100% ROI has broken even. Anything above that is profit. The complexity is not in the ratio. It is in defining “return” correctly, because not every dollar a member spends belongs to the program.
The standard formula is:
ROI = (Incremental Revenue − Total Program Cost) ÷ Total Program Cost × 100
Two words carry the weight in that equation: incremental and total. Incremental revenue excludes spend a customer would have made anyway. Total program cost includes every cost bucket, not just the platform license. Get either one wrong and the ROI figure you bring to the CFO will not survive the first follow-up question.
The most common ROI mistake is adding up everything loyalty members spend and calling it program revenue. That number is inflated, because your most valuable customers were always going to be your most valuable customers, program or not. What you need is the difference between what a member spends after joining and what a comparable non-member spends over the same period.
Metrics to Pull
At consumer ecommerce scale, teams often estimate incremental revenue with a rough before-and-after comparison. At enterprise scale, that is not good enough for a CFO or a risk committee. Run a holdout group: a statistically comparable segment of customers who are eligible for the program but not enrolled, tracked over the same period as members. The revenue gap between the two groups is your real incremental revenue, isolated from market growth, seasonality, or a macro uptick that had nothing to do with the loyalty program.
| Cost Bucket | What It Includes | Typical Owner |
|---|---|---|
| Technology | Platform licensing, implementation, integration, and ongoing engineering support | Marketing + IT |
| People | Program manager, campaign team, analyst time, and cross-functional hours from CX and risk | Marketing |
| Rewards and Liability | Redemption cost, partner rewards, and the accrued value of unredeemed points sitting as a liability | Finance |
| Compliance and IT Integration | Risk review cycles, data governance, core banking or OSS/BSS integration, and audit readiness | Risk + IT |
Every unredeemed point on a traditional earn-and-burn program sits on the balance sheet as a liability the enterprise owes its customers. It does not show up as a monthly invoice, which is why so many ROI calculations leave it out. But finance teams already track it, and it drags down the real return of the program even when the marketing dashboard looks healthy. This is the structural reason a behaviour-led model changes the ROI math: when engagement is built around actions the enterprise wants (activation, cross-sell, digital adoption) rather than transactions rewarded after the fact, less value sits unredeemed and unaccounted for. Engagement metrics that cannot be traced to revenue, and liability that cannot be traced to a behaviour, do not belong in a board deck.
The numbers below are illustrative only, built to show the mechanics, not benchmarks from a specific client.
A 400% ROI means the program returned four dollars for every dollar it cost, on top of breaking even. That is the number worth bringing to a board, because every input behind it can be defended line by line.
Public benchmarks are useful for context, though every enterprise program should be judged against its own holdout data first. According to Antavo’s Global Customer Loyalty Report 2025, brands surveyed reported their loyalty program generating an average of 5.2 times more revenue than it cost to run, up from 4.8 times the year before. Separately, Forrester has found that a majority of US online adults say loyalty programs influence both what they buy and where they buy it, which is the behavioural signal that underpins any incremental revenue calculation.
| Metric | Reported Benchmark | Source |
|---|---|---|
| Average loyalty program ROI multiple | 5.2x program cost (2025), up from 4.8x (2024) | Antavo GCLR 2025 |
| Time to reliable ROI signal | 12 to 14 months typical, based on redemption maturity | Antavo GCLR 2025 |
| US adults influenced by loyalty programs on what they buy | 54% | Forrester |
Most loyalty platforms hand you a dashboard of engagement metrics and leave the revenue attribution to you. Perx is built the other way. Every behaviour the platform triggers is mapped to a business outcome from the start, so the incremental revenue calculation is not a quarterly research project bolted on after the fact, it is built into how the program runs. Combined with real-time behavioural triggers and intent-based personalisation, that mapping is how Perx-run programs cut acquisition costs by up to 33x for enterprise clients: not by discounting harder, but by targeting the behaviour that actually drives the number the CFO is asking about.

Praveen Vadla is Senior Digital Marketing Manager at Perx Technologies. With over 10 years of experience in B2B SaaS marketing across the US and Southeast Asia, he focuses on customer loyalty, engagement, and retention strategy. He writes on how brands build lasting customer relationships in a mobile-first economy. Connect with Praveen on LinkedIn.


Blogs

Blogs
Sustainability

Blogs
Blogs


Perx Technologies Pte Ltd
20A Tanjong Pagar Road
Singapore 088443
An ISO/IEC27001:2013 and ISO 27018:2019 compliant cloud solution

© 2026 Perx Technologies. All rights reserved.
© 2026 Perx Technologies. All rights reserved.
© 2026 Perx Technologies. All rights reserved.
Hey! Shashank